
My COVID Times Diary: For the last time, this is not JUST a flu!
 We live in a fantasy world, a world of illusion. The great task in life is to find reality. ~ Iris Murdoch
We are now almost eleven months into the COVID-19 pandemic here in the US. I typically use the date of March 12th as the starting date for the pandemic as that was the day my college closed down and we started working from home. I understand that in fact the virus had been in the country for two to three months at that point. And that some places like New York City, were already full blown into the impact of the pandemic earlier. But for me it’s a convenient and easy to remember starting point. And although we are nearly eleven months from that date, to my amazement I still frequently see people who continue to claim it’s all publicity stunt, a hoax, that this is really nothing more than the flu.
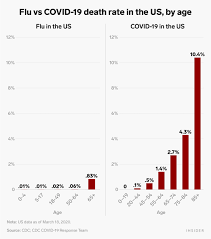
I’m going to keep this simple and straight forward tonight. The graph at the top of this piece shows the death rate difference between the flu and COVID. Although the age ranges are not perfectly aligned, if you look at the death rate for the flu for people in their fifties is less than 0.1%, while the death rate from COVID is around 2%, that’s 20 times higher. And as is very clear from both graphs, the risk of death from both diseases increases with age. However, with COVID, the death rate as you get older is magnitudes larger. Now, people have trouble with percentages and rates of increase, so let’s simplify it further still.
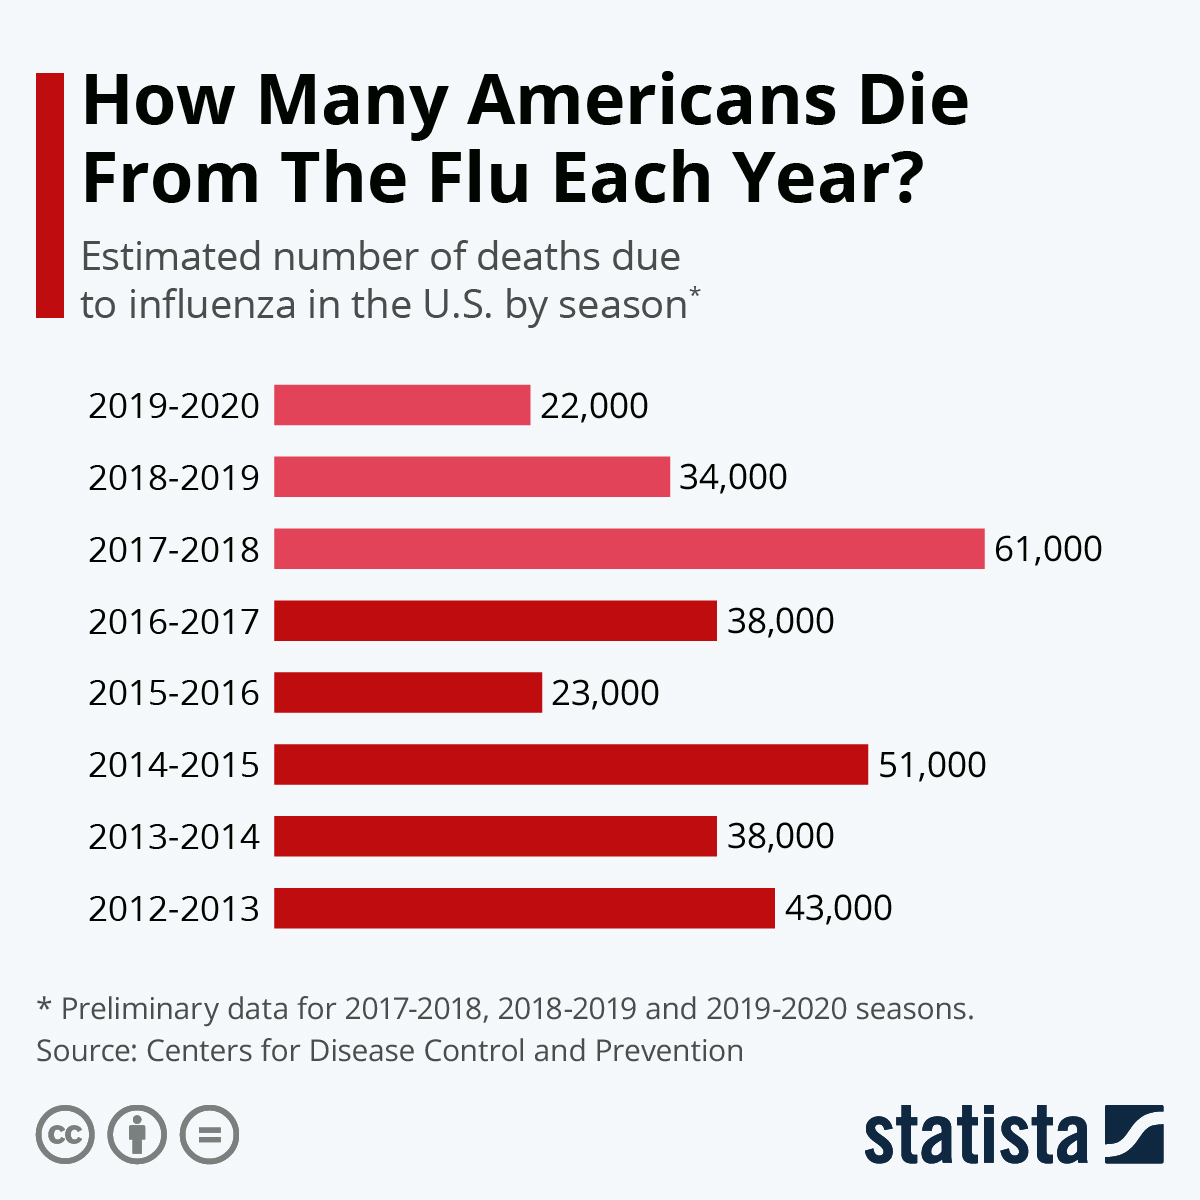 As you can see from the figure directly above, if you add the total and divide by eight, you find that the average number of flu deaths per year, over the last eight years is a little less than 39,000 people per year. The number of deaths in the US currently, according to the CDC COVID tracker, is almost 440,000 people. Now one thing I hear all of the time is that the COVID numbers are inflated, hospitals are calling any death a COVID death. There is of course no evidence of this what so ever. But ok, let’s halve the number of COVID deaths, so instead of over ten times as many as a flu year, it would be over five times as many. When you look at the figure above you’ll see that the worst flu year in the figure is a year of 61,000 deaths. That’s one seventh of the deaths we have had in less than a year. And currently over 3,000 people a day are dying, so another month of this could see as many as an additional 100,000 deaths. In the month of December there were over 65,000 COVID deaths in the US, that means in a single month more people died of COVID than die in the worst of flu years. It doesn’t get any simpler than these death numbers, COVID is killing significantly more people than flu ever does. Additionally, this massively higher death number occurred while we actively reduced social contact and, at least at the state and county level most places, encouraged mask wearing. So these higher death numbers occurred in a social situation established to limit the spread of the disease. Had we not done that, the death rate would have been even higher.
But in addition to the massive death rate from COVID, there is another issue that doesn’t occur with the flu, long COVID. Long COVID is a situation where people often have long-term lingering effects from having COVID. These include things like headaches, fatigue, shortness of breath, and often for months after they have recovered from an active COVID infection. lt is too soon to tell if some of these impacts will last for years, or may even lead to permanent disabilities for these people. So not just more death, but more suffering as well.
There is simple and obvious evidence that COVID is a far more serious issue than the seasonal flues that we deal with annually. The only way someone doesn’t see or understand this comes down to one thing, they have simply decided not to see it. They are refusing simple basic math and choosing instead to opt for conspiracy theories and fantasy. The pandemic seems to have exacerbated this type behavior in the weakest among us which is unfortunate.
